St. Peter

Our Patron Saint!
Monday, March 12, 2012

Wednesday, March 7, 2012
Awesome Percent Game - Create a park!!!
Check this out! Let us know how far you have gotten.
http://www.kidsmathgamesonline.com/numbers/percentages.html
What do you think of this game? Have you found a better game that involves percent? Let is know...
http://www.kidsmathgamesonline.com/numbers/percentages.html
What do you think of this game? Have you found a better game that involves percent? Let is know...
March 7th and 8th - Great Math Game and Practice Activities involving Percent!!!
Number Invaders!!! What is your highest score?
http://www.mathplayground.com/balloon_invaders_percent.html
Click on the link below to view a video about the math concepts we learned about today!!!
http://www.mathplayground.com/howto_findsaleprice.html
Practice questions for Percent - find one, solve it and share it in class tomorrow.
http://www.mathplayground.com/SMP_Percent.html
http://www.mathplayground.com/balloon_invaders_percent.html
Click on the link below to view a video about the math concepts we learned about today!!!
http://www.mathplayground.com/howto_findsaleprice.html
Practice questions for Percent - find one, solve it and share it in class tomorrow.
http://www.mathplayground.com/SMP_Percent.html
Friday, February 10, 2012
Cryptopics link and link to Percentage Game
Check out the link below for more "cryptopics" puzzles...
http://www.yarivh.com/cryptopics/index.htm
Enjoy!
Click on the comments - Eric and Maisie found an electronic version of Cryptopics online! Use the link Maisie posted.
http://www.yarivh.com/cryptopics/index.htm
Enjoy!
Click on the comments - Eric and Maisie found an electronic version of Cryptopics online! Use the link Maisie posted.
Wednesday, February 8, 2012
Link to Math Makes Sense Tutorial! Check it out!
Having trouble with a math concept and you can't wait until tomorrow to discuss it in class!!!
Click on this link and check out the tutorial on any concept in our textbook!
https://2007.hcdsb.org/owa/redir.aspx?C=6d063210c74a4ad5b3f9b9577088cb1d&URL=http%3a%2f%2fwww.pearsoned.ca%2fschool%2fmath%2fmathmakessense7%2f
Click on this link and check out the tutorial on any concept in our textbook!
https://2007.hcdsb.org/owa/redir.aspx?C=6d063210c74a4ad5b3f9b9577088cb1d&URL=http%3a%2f%2fwww.pearsoned.ca%2fschool%2fmath%2fmathmakessense7%2f
Monday, January 30, 2012
Possible Research Topic for our Data Management Project
Use this link to view sales stats from each month in 2010 and 2011. Your comparison could be between Xbox hardware sales and Wii hardware sales.
http://vgsales.wikia.com/wiki/NPD_sales_figures
You will need to click on each month and write the sales amount in a table. Then plot the data on a scatterplot graph.
http://vgsales.wikia.com/wiki/NPD_sales_figures
You will need to click on each month and write the sales amount in a table. Then plot the data on a scatterplot graph.
Tuesday, January 24, 2012
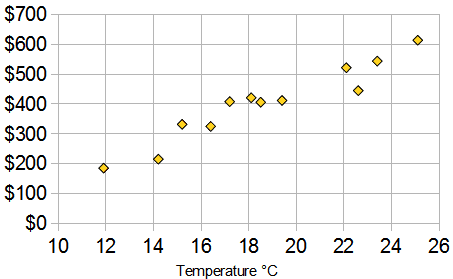
January 24, 2012 - Analyze the Data - Is there a relationship between temperature and ice cream sales?
| Ice Cream Sales vs Temperature | |
| Temperature °C | Ice Cream Sales |
|---|---|
| 14.2° | $215 |
| 16.4° | $325 |
| 11.9° | $185 |
| 15.2° | $332 |
| 18.5° | $406 |
| 22.1° | $522 |
| 19.4° | $412 |
| 25.1° | $614 |
| 23.4° | $544 |
| 18.1° | $421 |
| 22.6° | $445 |
| 17.2° | $408 |
And here is the same data as a Scatter Plot:
Line of Best Fit
You can also draw a "Line of Best Fit" (also called a "Trend Line") on your scatter plot: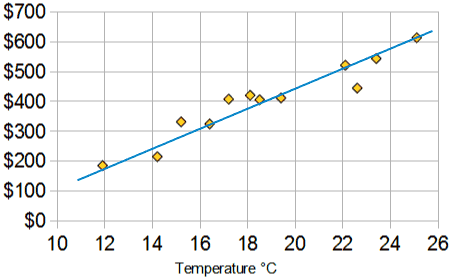
Subscribe to:
Posts (Atom)